What does malware look like? Unfortunately there are so many types of malicious software that there is no clear way to find and detect it all, but in many situations GlassWire can help.
The screenshot above comes from a fan in Europe who emailed to tell us how GlassWire found an infection on his computer that was not detected by his antivirus software. In this case GlassWire alerted the user that something was trying to send all his traffic over a proxy many times per day. After locating the file that was responsible via GlassWire’s “new” network activity feature the user could then upload it to VirusTotal. This new malware was only recognized by a few of the VirusTotal scanners but luckily GlassWire’s network visualization allowed the user to see a strange pattern that alerted him to the problem.
Did GlassWire help you detect malware or find another problem with your network or computer? Please let us know via Twitter, Facebook, Blog Comments, or email. We love to see your malware patterns on the GlassWire graph!
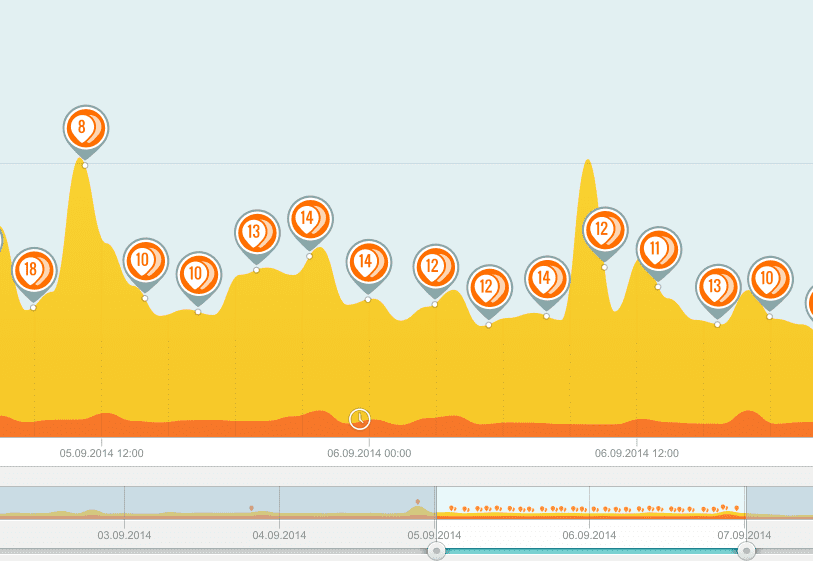
Update: Some GlassWire users have asked more details about what the visualization above is showing. In this case GlassWire was detecting that malware was trying to change proxy settings on the computer every few minutes. You can see examples of the alerts under GlassWire’s “alerts” tab below. Normally the alerts would have an icon like the one shown below but since they were happening so often the proxy change alert icon was changed to a number.

The rest of the graph shows incoming and outgoing bandwidth. You can see the malware was trying to download and upload data. The light color is downloaded data and the darker color is uploaded data. If I had shown the full GlassWire graph you would see an up and down arrow in the user interface that explains what colors represent incoming and outgoing bandwidth.
The bottom of the graph shows the time line. You can drag the sliders back and forth to focus in on a certain time and date on the graph using the GlassWire software. The clock icon and shading on the graph means the user was idle when all this activity occurred.
If you have any more questions feel free to reply in the comments.
If you don’t have GlassWire already download it free here.